
The promise of educational technology has always been vast, but for school leaders, curriculum directors, and classroom teachers, a central question remains: Is technology actually making a meaningful, measurable difference in student learning? Are the toold w ebring into the classroom driving engagement and impacting our classes?
At the Apple event ‘Designed for Every Kind of Learner – Kuala Lumpur ‘, Dr. Damian Bebell, Research Professor at Boston College, addressed this challenge head-on. Drawing from an extensive global dataset representing more than 17,000 educators across 30+ countries, Dr. Bebell shared critical findings on student engagement, data-informed pedagogy, and how schools can break free from obsolete measurement frameworks to align digital tools with their core missions.
The Assessment Bottleneck: Breaking Free from the “MIA Model”
To evaluate whether technology is working, schools must first define what success actually means. Dr. Bebell notes that when analyzing thousands of school mission statements worldwide, clear patterns emerge: roughly 60% explicitly emphasize academic achievement and cognitive development, while over 50% prioritize social-emotional growth, character building, and holistic learner development.
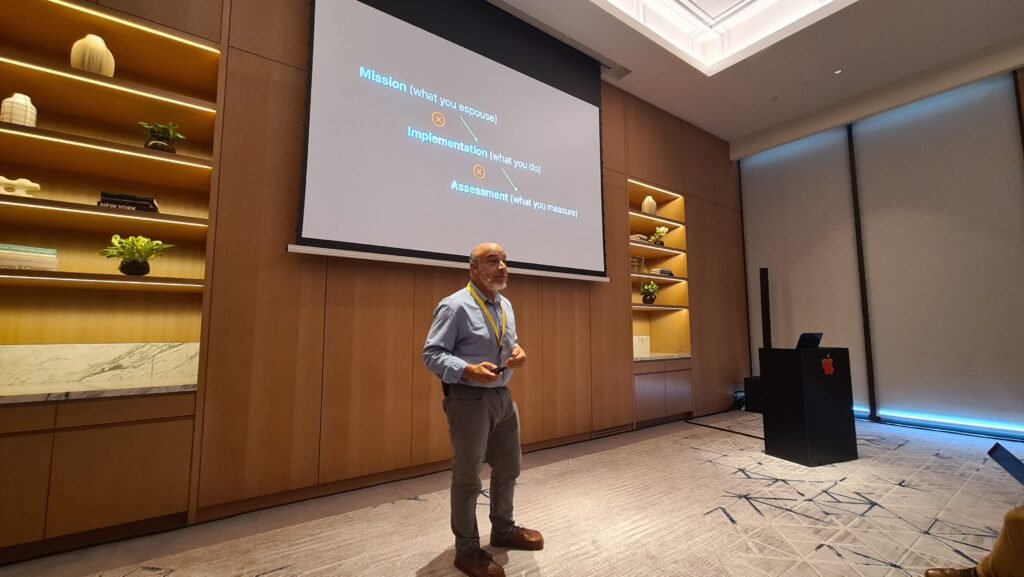
Most schools succeed at translating these ambitious missions into daily learning experiences. However, when it comes to measuring outcomes, the system collapses into what Dr. Bebell terms the MIA Model:
- M — Mission: Broad, human-centered aspirations (academics, character, global citizenship, emotional development).
- I — Implementation: Dynamic curricula, collaborative projects, modern technology integration, and rich learning environments.
- A — Assessment: Missing In Action.
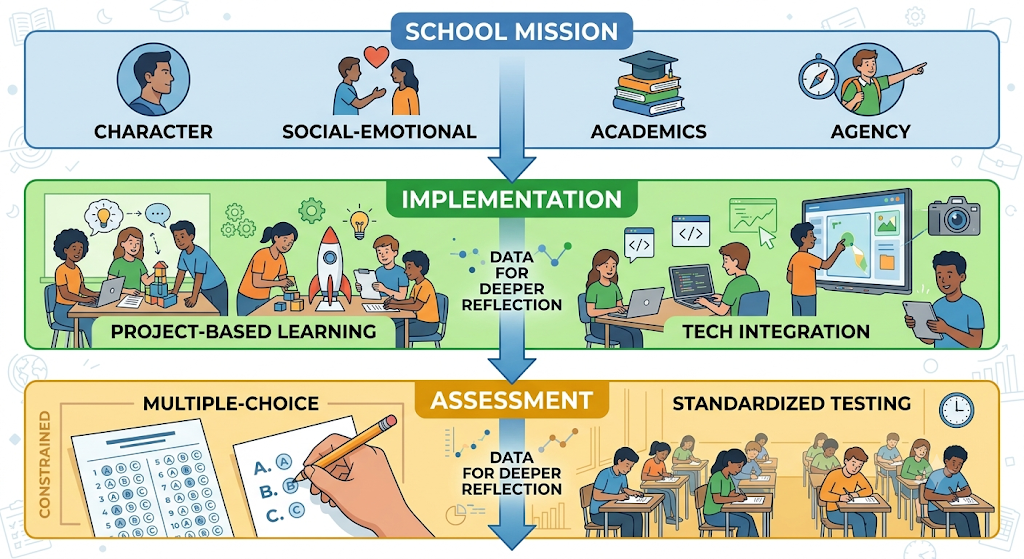
When assessment occurs, schools routinely reduce complex learning to standardized testing formats designed nearly a century ago; systems anchored by single correct answers and multiple-choice distractors. When this type of assessment is constrained to these 20th-century methods, it fails to capture the multi-dimensional growth happening in modern classrooms.
Unlocking Hidden Insights Through Student Drawings
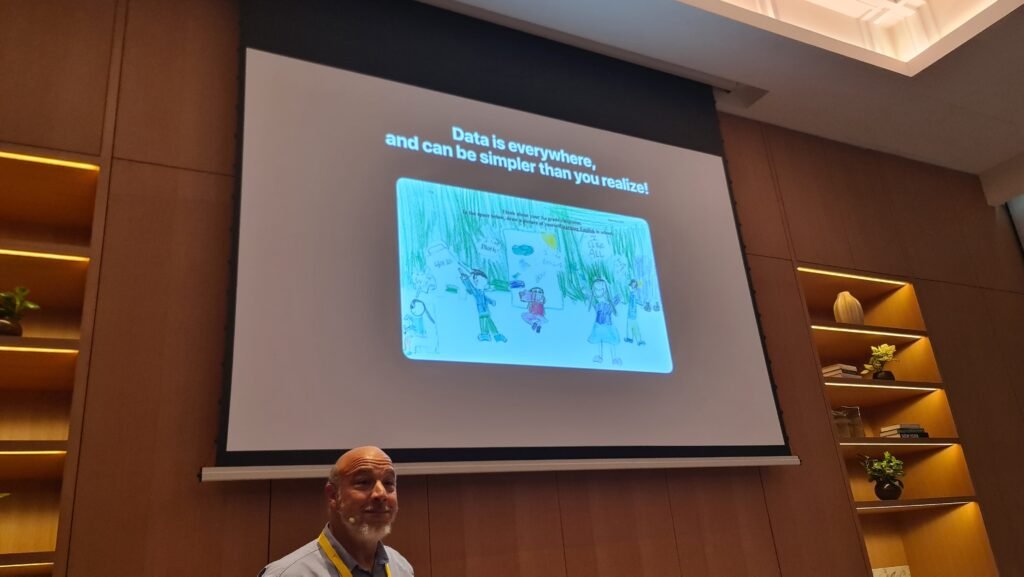
When evaluating classroom culture and the impact of instructional technology, complex statistical models only tell part of the story. Qualitative artifacts can often provide immediate, profound data on how students actually experience their learning environment. In research across diverse school systems—including a study tracking one-to-one laptop integration across New York City public schools—one of the most revealing evaluation tools proved to be remarkably simple: asking young learners to draw a picture of themselves in class. Because children express their underlying feelings and perceptions visually long before they can articulate them in a survey, these artwork samples serve as a powerful mirror reflecting classroom dynamics, physical layout constraints, and emotional well-being.
The contrast between different learning environments becomes instantly apparent when analyzing these visual assessments. In an engaged, active classroom setting, student artwork consistently depicts vibrant, multi-dimensional learning. As shown in Figure 1, students draw themselves with bright smiles, collaborating at distinct learning stations, engaging in varied tasks like reading, writing, and digital exploration, while the teacher moves fluidly around the room as a facilitator. This simple diagnostic tool captures essential dimensions of student agency, peer collaboration, and positive affect that traditional testing completely overlooks, demonstrating how thoughtfully integrated technology supports an open, student-centered culture.
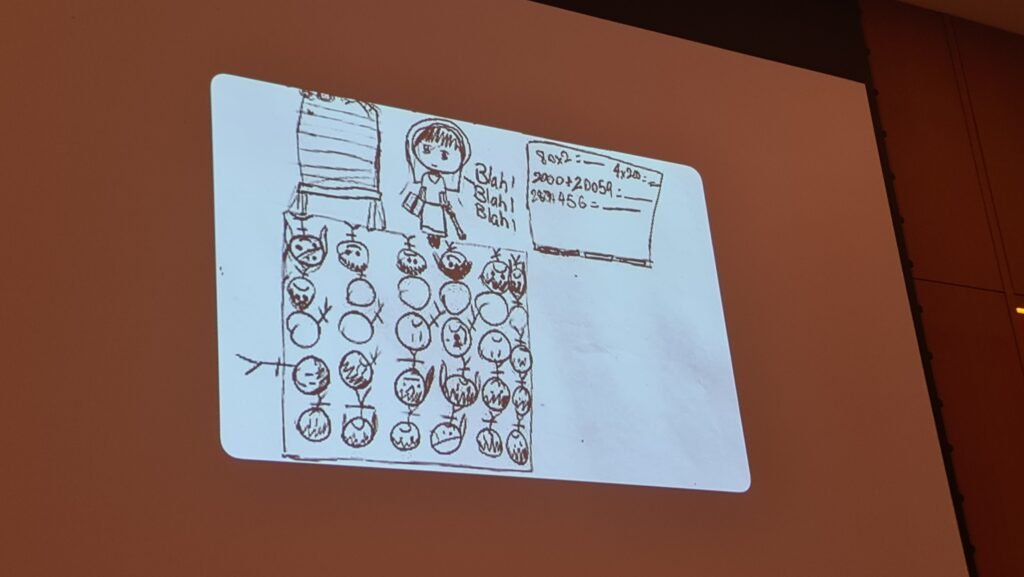
Conversely, drawings collected from more traditional, highly rigid settings paint a starkly different picture. As illustrated in Figure 2, students frequently depict themselves seated in isolated, tightly packed rows, often drawn with blank or expressionless faces—or even smiling toward the exit door. In these depictions, technology is present (such as an interactive whiteboard), but it remains static, with the teacher tethered to the front of the room delivering top-down instruction. When teachers collect and reflect on these collection sets from their own classrooms, it sparks immediate professional self-reflection. Rather than serving as a punitive metric, student drawings act as a compassionate, actionable diagnostic tool, prompting educators to ask why these patterns exist and how physical spaces, pedagogy, and digital tools can be reconfigured to bring joy back into learning.
What 17,000 Classrooms Reveal About Student Engagement
Educational research shows a well-documented global trend: as students progress through primary and secondary education, their overall school engagement steadily declines.
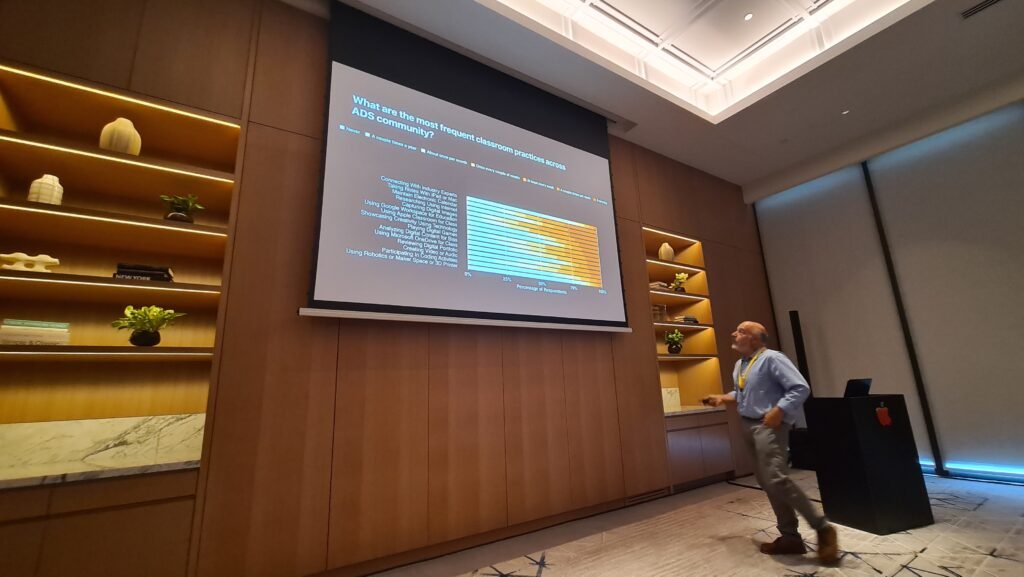
To understand how technology might disrupt this “disengagement crisis,” Dr. Bebell’s research team at Boston College evaluated practice patterns across 300+ Apple Distinguished Schools worldwide, encompassing pre-K through 12th-grade classrooms across all subject areas.
| LEARNING PRACTICE | IMPACT ON STUDENT ENGAGEMENT |
| Student-Led Media Creation Digital Portfolios & Publishing Game-Based Learning Teacher Instructional Delivery Passive Note-Taking Administrative / File Storage | Very High (Strongest universal predictor) High High Modest Neutral (No statistical correlation) Neutral (No statistical correlation) |
1. Creation Over Consumption
The single strongest predictor of student engagement across all grade levels, subject areas, and geographic regions is students using devices to create.
- High-Impact Practices: Capturing and manipulating digital media, building digital portfolios to publish work, and participating in curriculum-aligned game-based learning.
- Low-Impact Practices: Digital note-taking and cloud file management. While digitized note-taking offers administrative efficiency, data shows no statistical correlation with increased student engagement.
2. Student Agency Outweighs Teacher Presentation
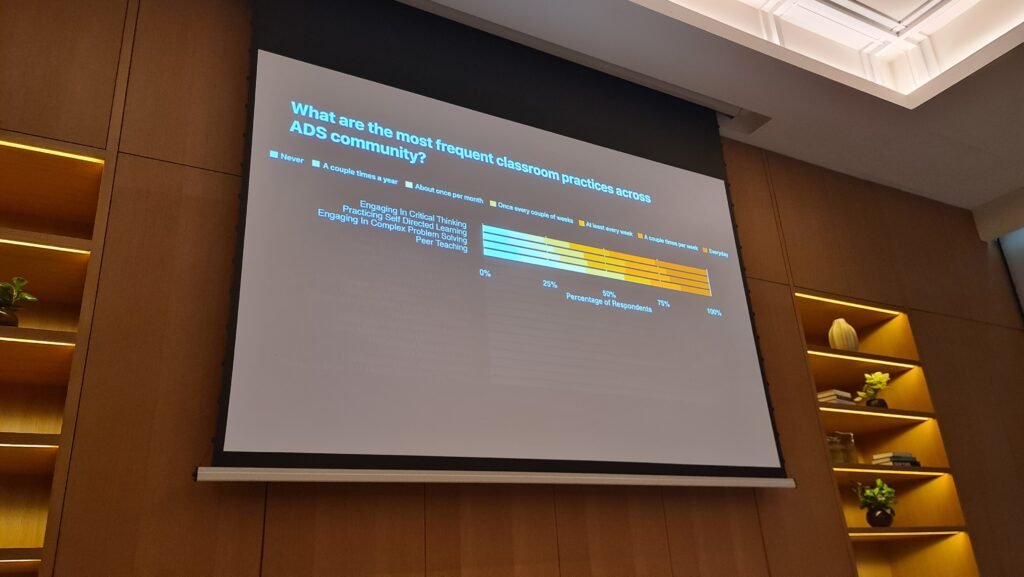
Teacher-led technology delivery—such as projecting slides or instructional media—accounts for approximately 73% of classroom tech usage in the study. While effective for instructional delivery, it yields only a modest correlation with student engagement. The most significant gains in enthusiasm and self-efficacy occur when devices are placed directly in the hands of students for active, self-directed tasks.
3. Personalization & Teacher Satisfaction
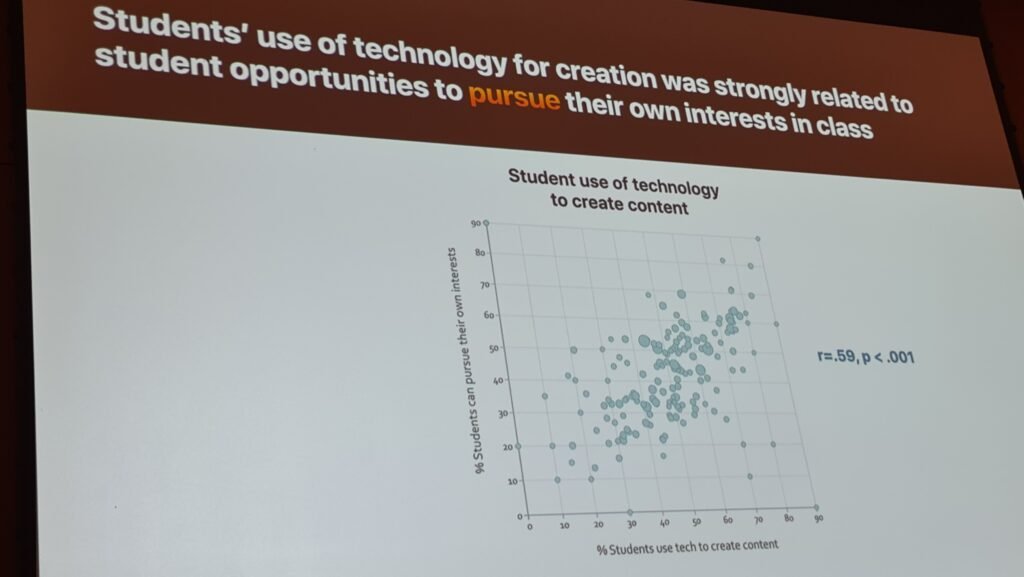
Technology serves as a primary vehicle for differentiation. Classrooms where technology allows students to pursue personal interests within the curriculum report higher student engagement and stronger teacher job satisfaction. Notably, teachers who invest the time required to facilitate dynamic, student-centered technology lessons report higher self-efficacy and lower rates of professional burnout.
Unconventional Data: Simple Tools for Deep Reflection
Evaluating classroom technology does not always require complex statistical modeling. Qualitative evaluation tools often reveal immediate, actionable insights for school leaders and staff:
- Student Visual Representations: Asking students to “draw a picture of yourself in class” provides clear qualitative data about classroom dynamics. Drawings frequently expose physical layout constraints, teacher positioning, student affect, and the degree of collaboration or isolation present during instruction.
- Perception Audits: Schools often face parent anxiety regarding screen time. In one study, parents estimated their children spent 65% of the school day on screens. However, system audit logs and teacher reports revealed actual instructional screen usage was between 15% and 25%. Collecting basic perception data allows leadership to address community concerns with precise facts.
Strategic Takeaways for Educational Leaders
- Shift from Passive to Active Tech Use: Reallocate technology integration goals toward student generation (digital media, design, coding, portfolios) rather than content consumption (digitized worksheets, passive reading, digital note-taking).
- Realign Metrics with Mission: Audit your school’s assessment stack. Ensure that the tools used to measure success capture social-emotional growth, creative problem-solving, and critical thinking rather than relying solely on cognitive testing formats.
- Use Data as a Reflective Mirror: Deploy simple data collection methods—such as student artwork or quick usage audits—to foster non-punitive, reflective dialogue among instructional staff.
For complete access to the global statistical models, methodologies, and findings, read the full research paper: Engaged Teaching, Engaged Learning.